¡Hola a todos!
Muchos sabéis que Global Masters está activo de nuevo. Otros quizás no sepáis en qué consiste.
Global Masters es un programa de recompensas donde se os premia por participar en la comunidad: escribir artículos, comentar, realizar desafíos (conocidos como Asks)
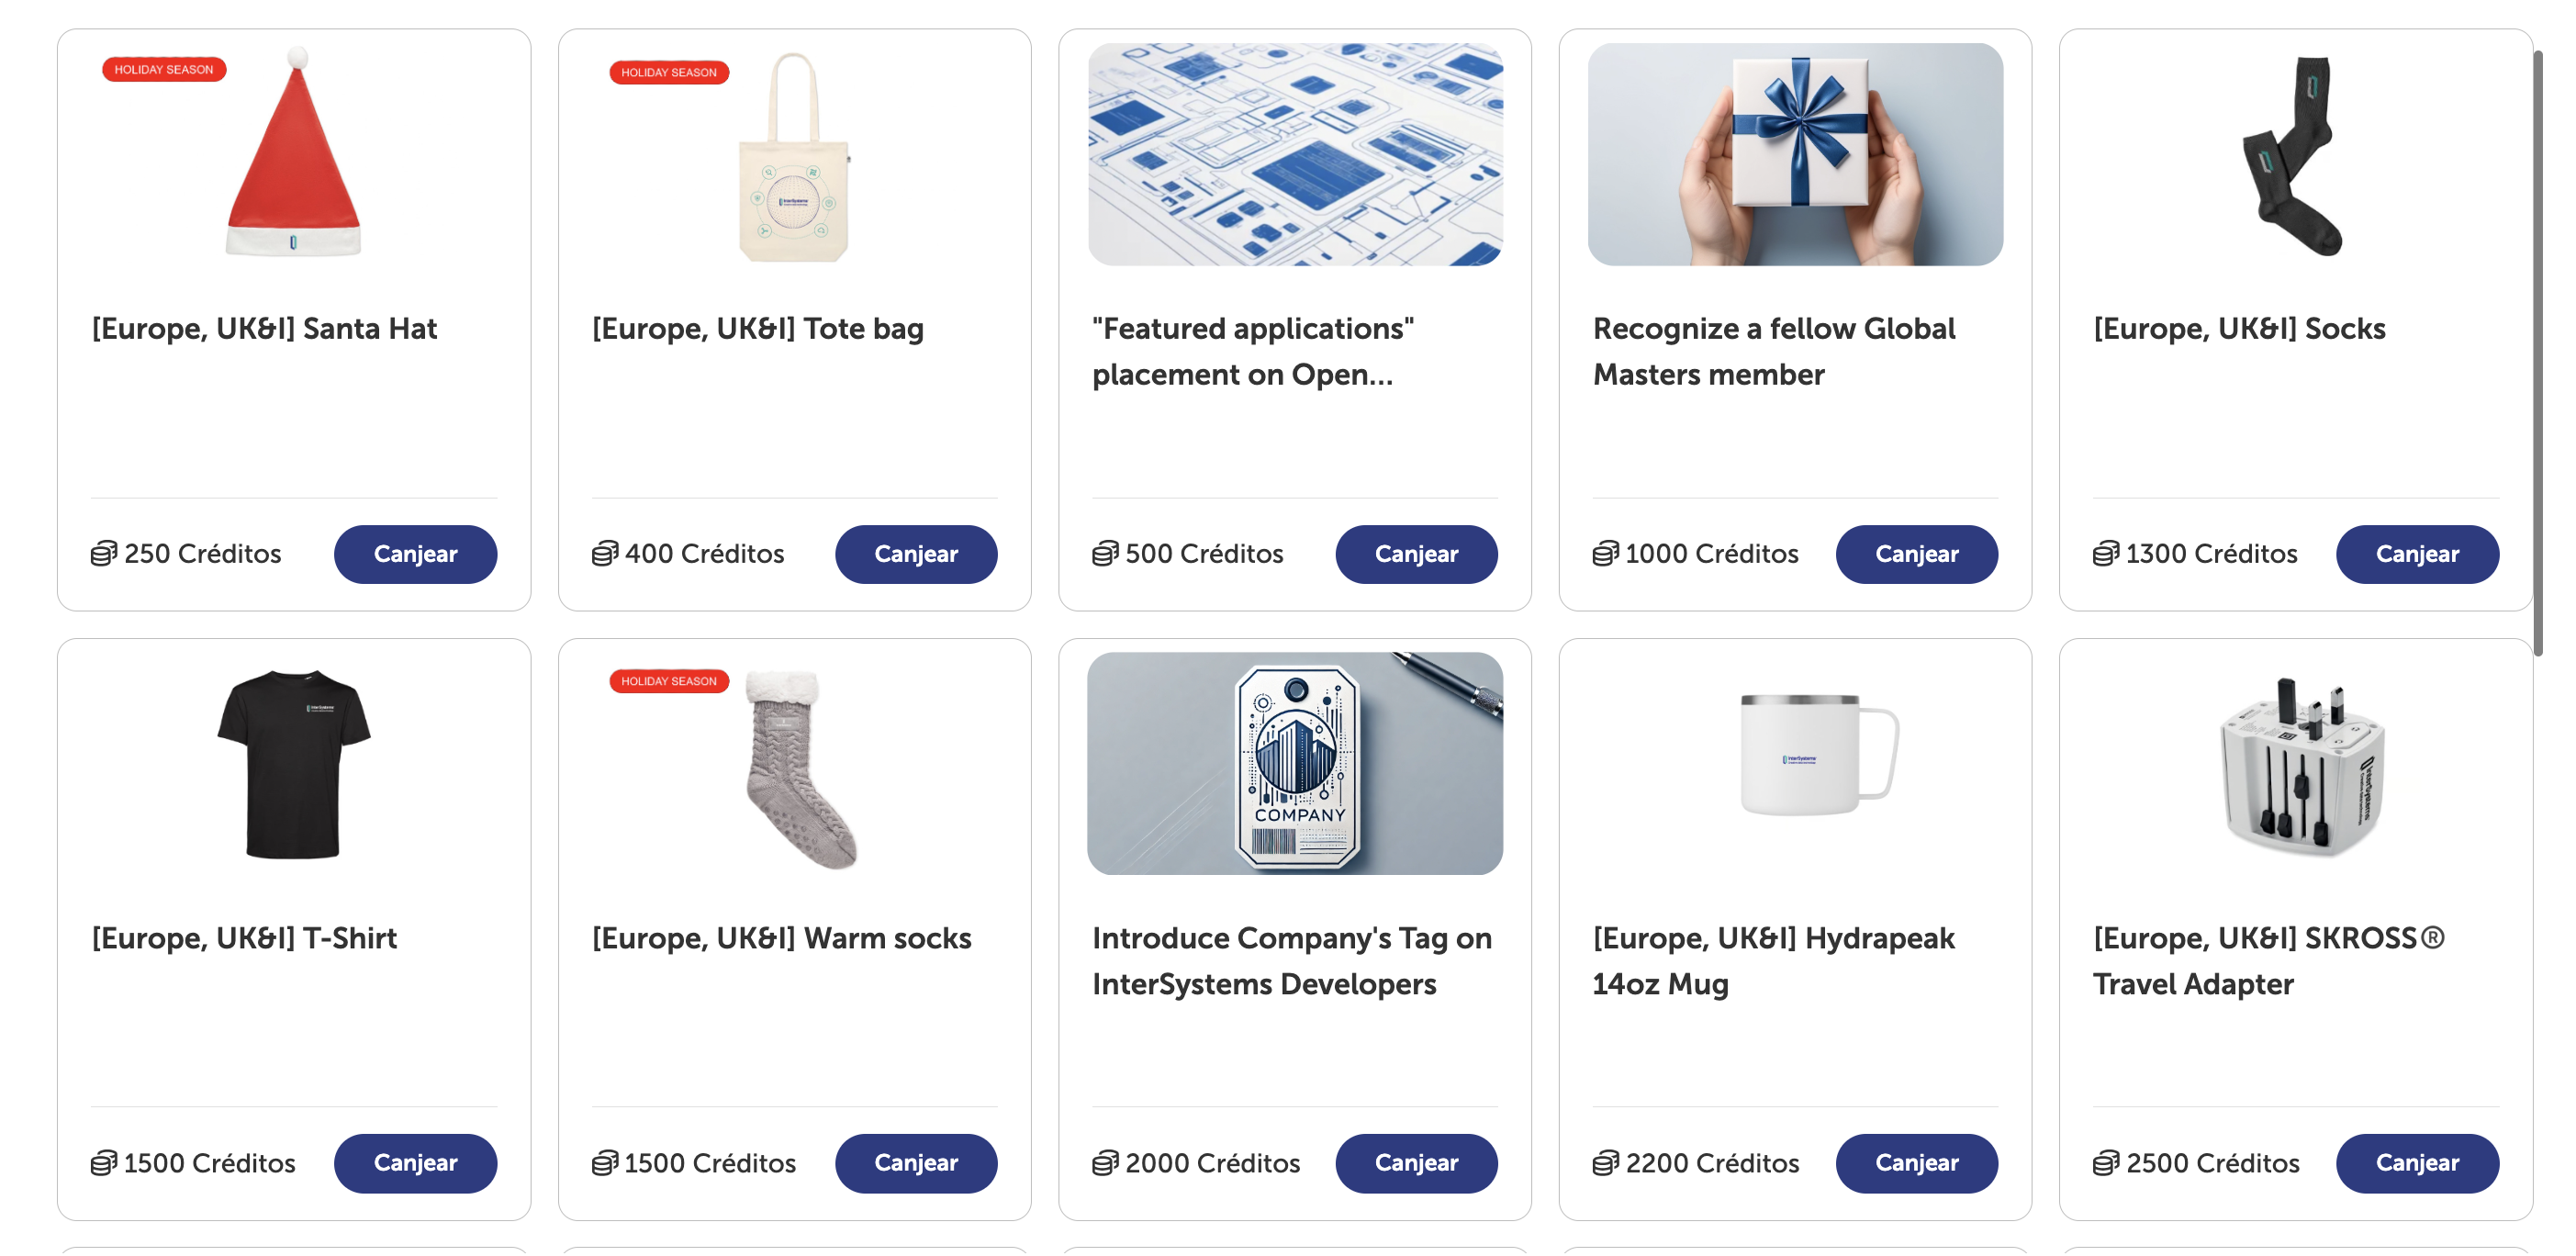
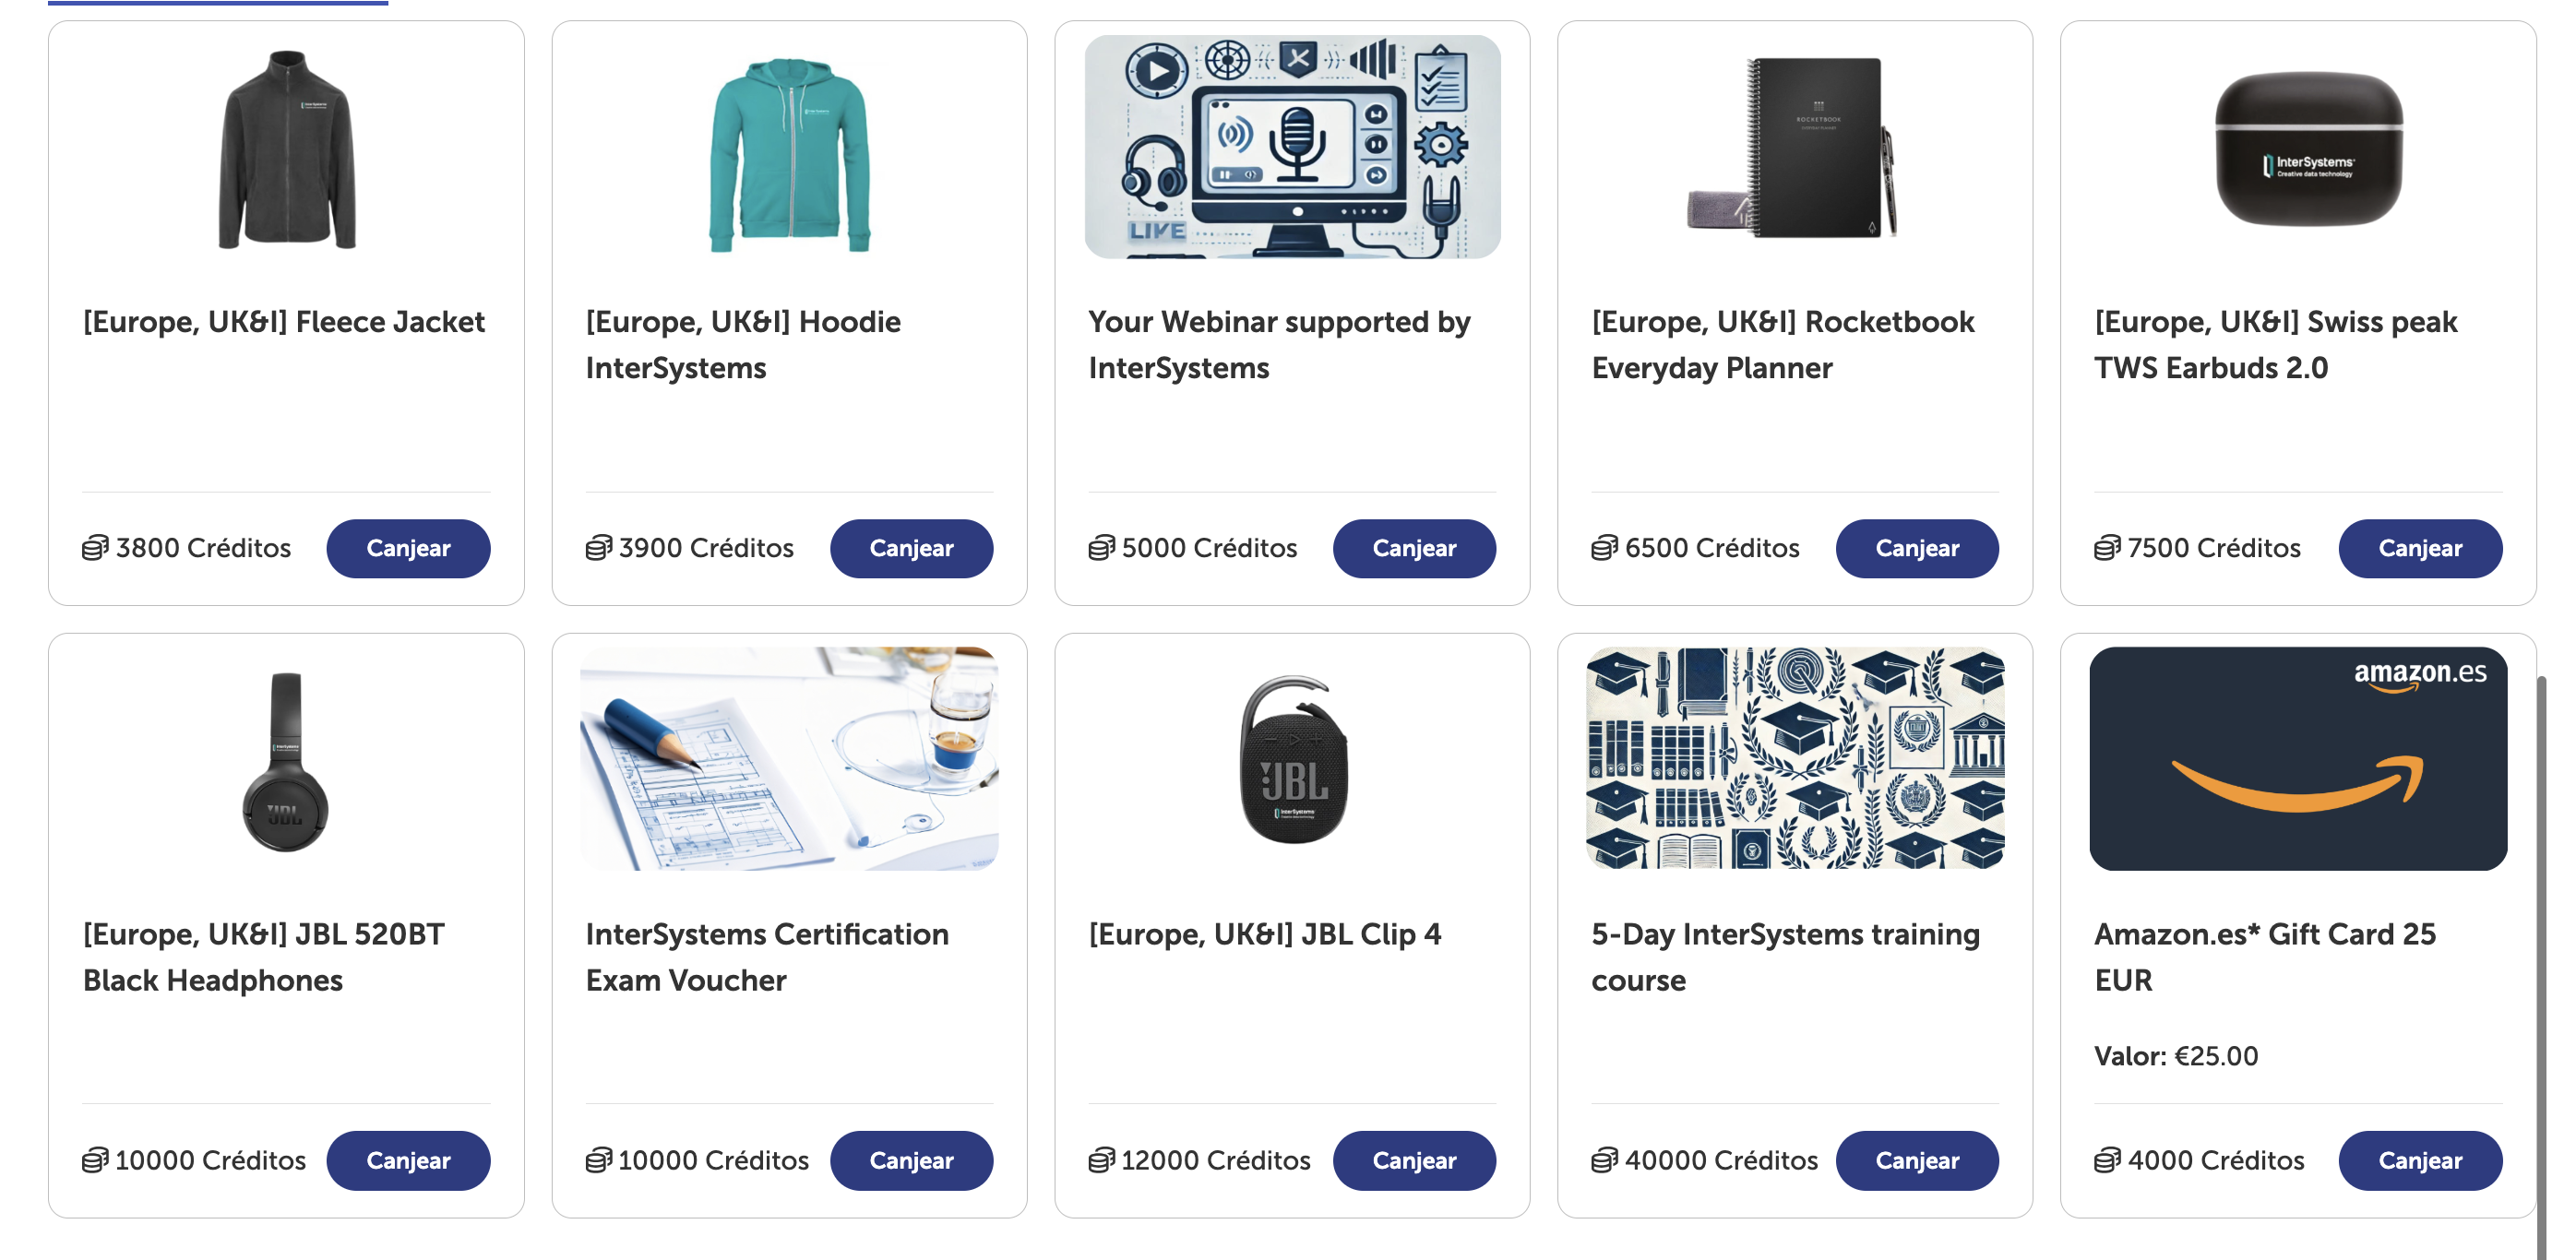
¿Y qué premios podéis conseguir? ¡Vamos a verlo!
Pues tenéis desde las míticas tazas de InterSystems, calcetines... ¡pero también auriculares, chaquetas y hasta formación! (Los artículos de Navidad son de disponibilidad limitada ¡Feliz Navidad a todos...!)
 Vale pero... ¿Por dónde empiezo?
1. Primero, id a la plataforma para iniciar sesión, si es que no lo habéis hecho.

2. Segundo, podéis echar un vistazo a los "asks" o desafíos. Son una forma sencilla de conseguir los primeros puntos y participar en la comunidad. Aquí encontraréis buenas recomendaciones de artículos (se os premiará por leerlos), así como desafíos estacionales. Actualmente hay uno de recetas navideñas muy bueno.

3. Tercero ¡La Comunidad de Desarrolladores! Es la mejor excusa para participar. Plantead vuestras preguntas, comentad en publicaciones que os parezcan interesantes o atreveos a aportar vuestro granito de arena con un artículo contando algo que hacéis en vuestro día a día.
Pronto veréis desafíos exclusivos para la comunidad en Español.
¡Un millón de gracias a @Olga Zavrazhnova y todo el equipo por traer de vuelta Global Masters! Os deseo un buen fin de año. Aprovechad estos días para visitar la plataforma... 😎
.jpg)
.png)

.png)
.png)
 Open Exchange