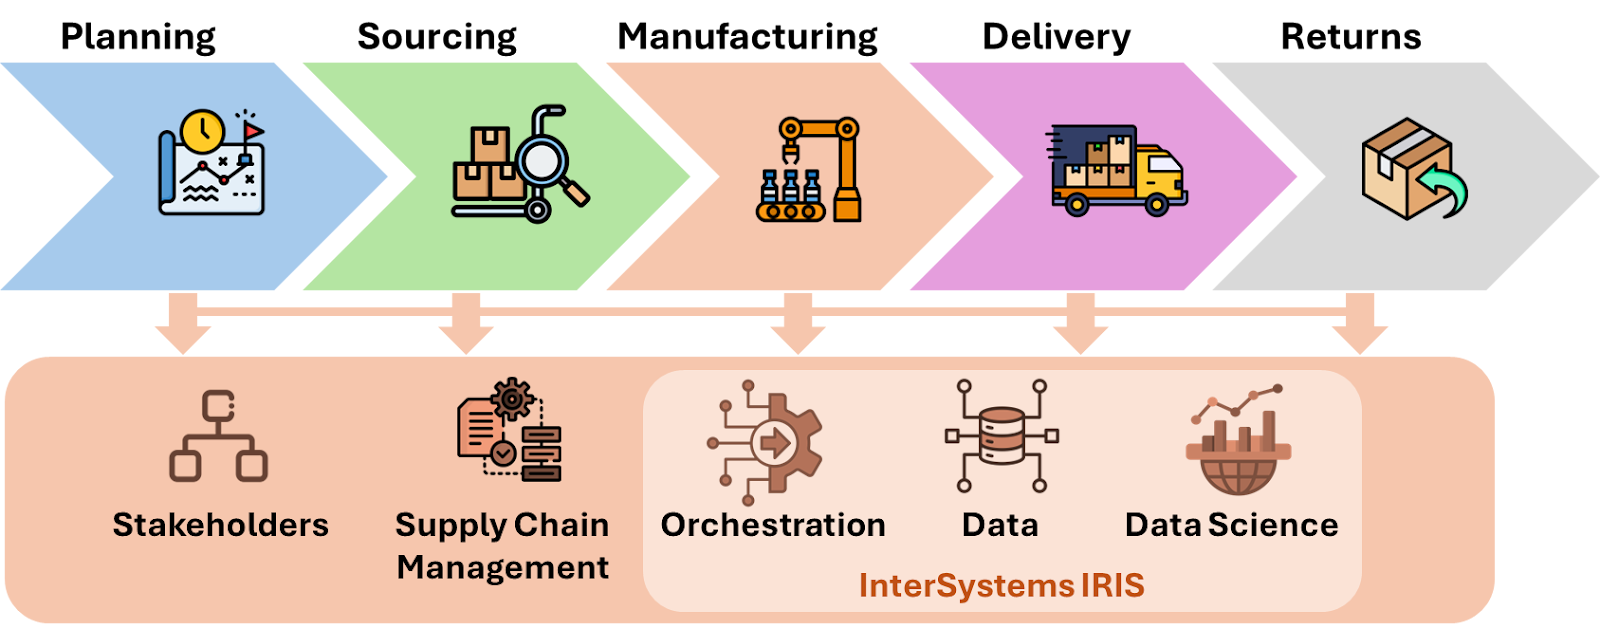
Supply Chain refers to a set of processes and activities performed by the company's business areas and its suppliers and partners (stakeholders), from the acquisition of raw materials, through production, to delivery to the end consumer. It can be better managed using SCM solutions with the orchestration of the InterSystems IRIS:
Planning process
All Supply Chain processes demand strong planning, always supported by data and analyses necessary to plan and execute activities in line with quality, accuracy, agility, and economy in the acquisition of raw materials, production, storage, delivery (logistics), and, if necessary, return (reverse logistics) of products to the end consumer. The InterSystems IRIS can support Supply Chain planning with its interoperability, database and analytics features:
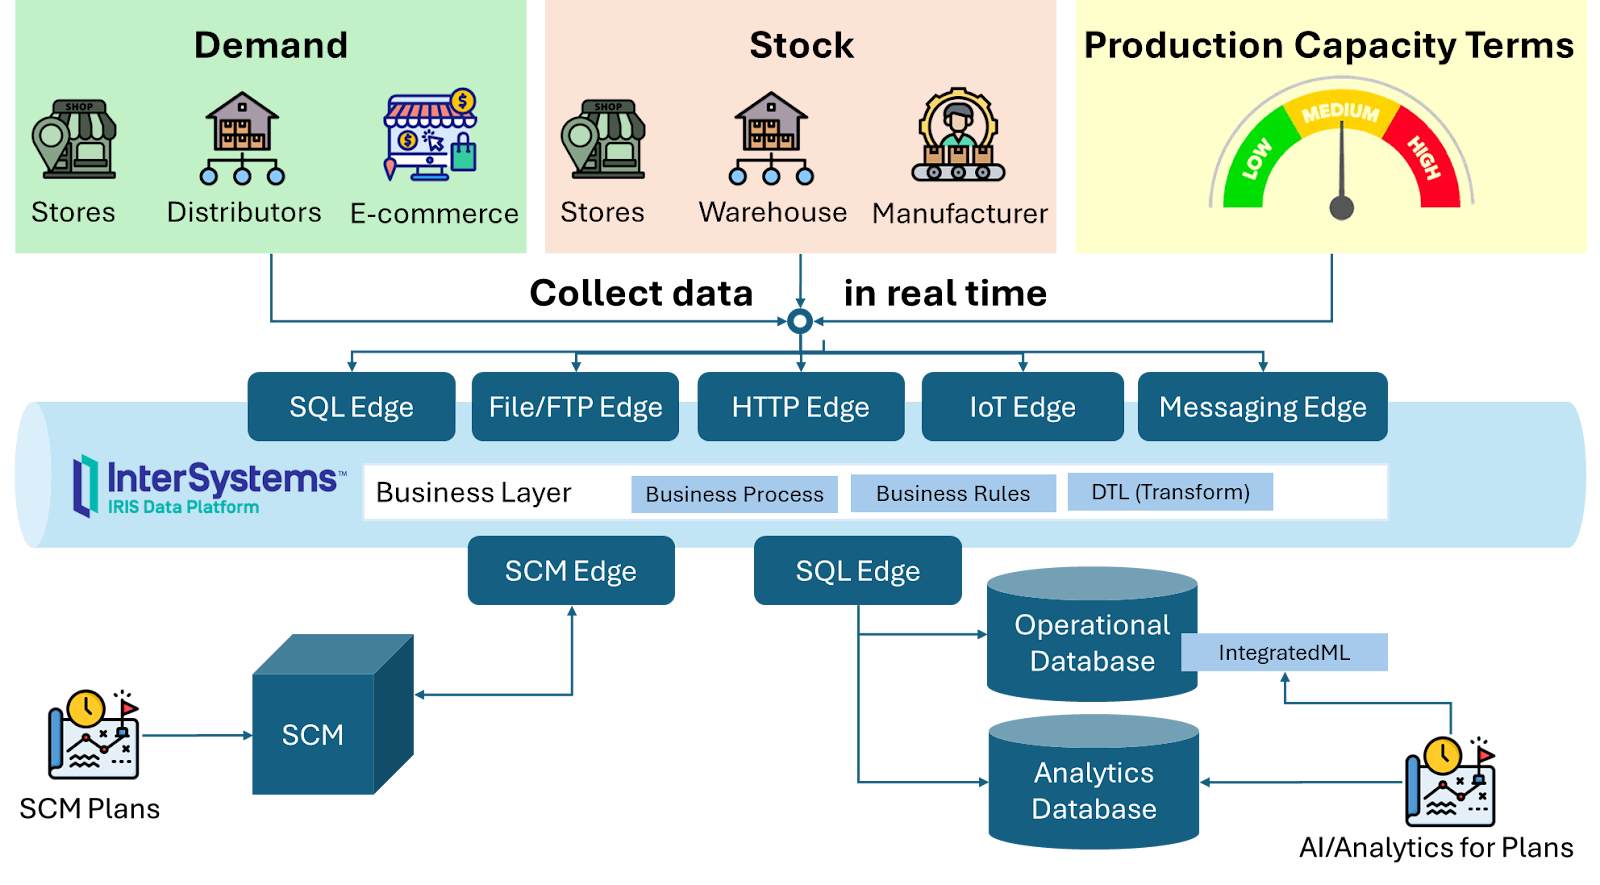
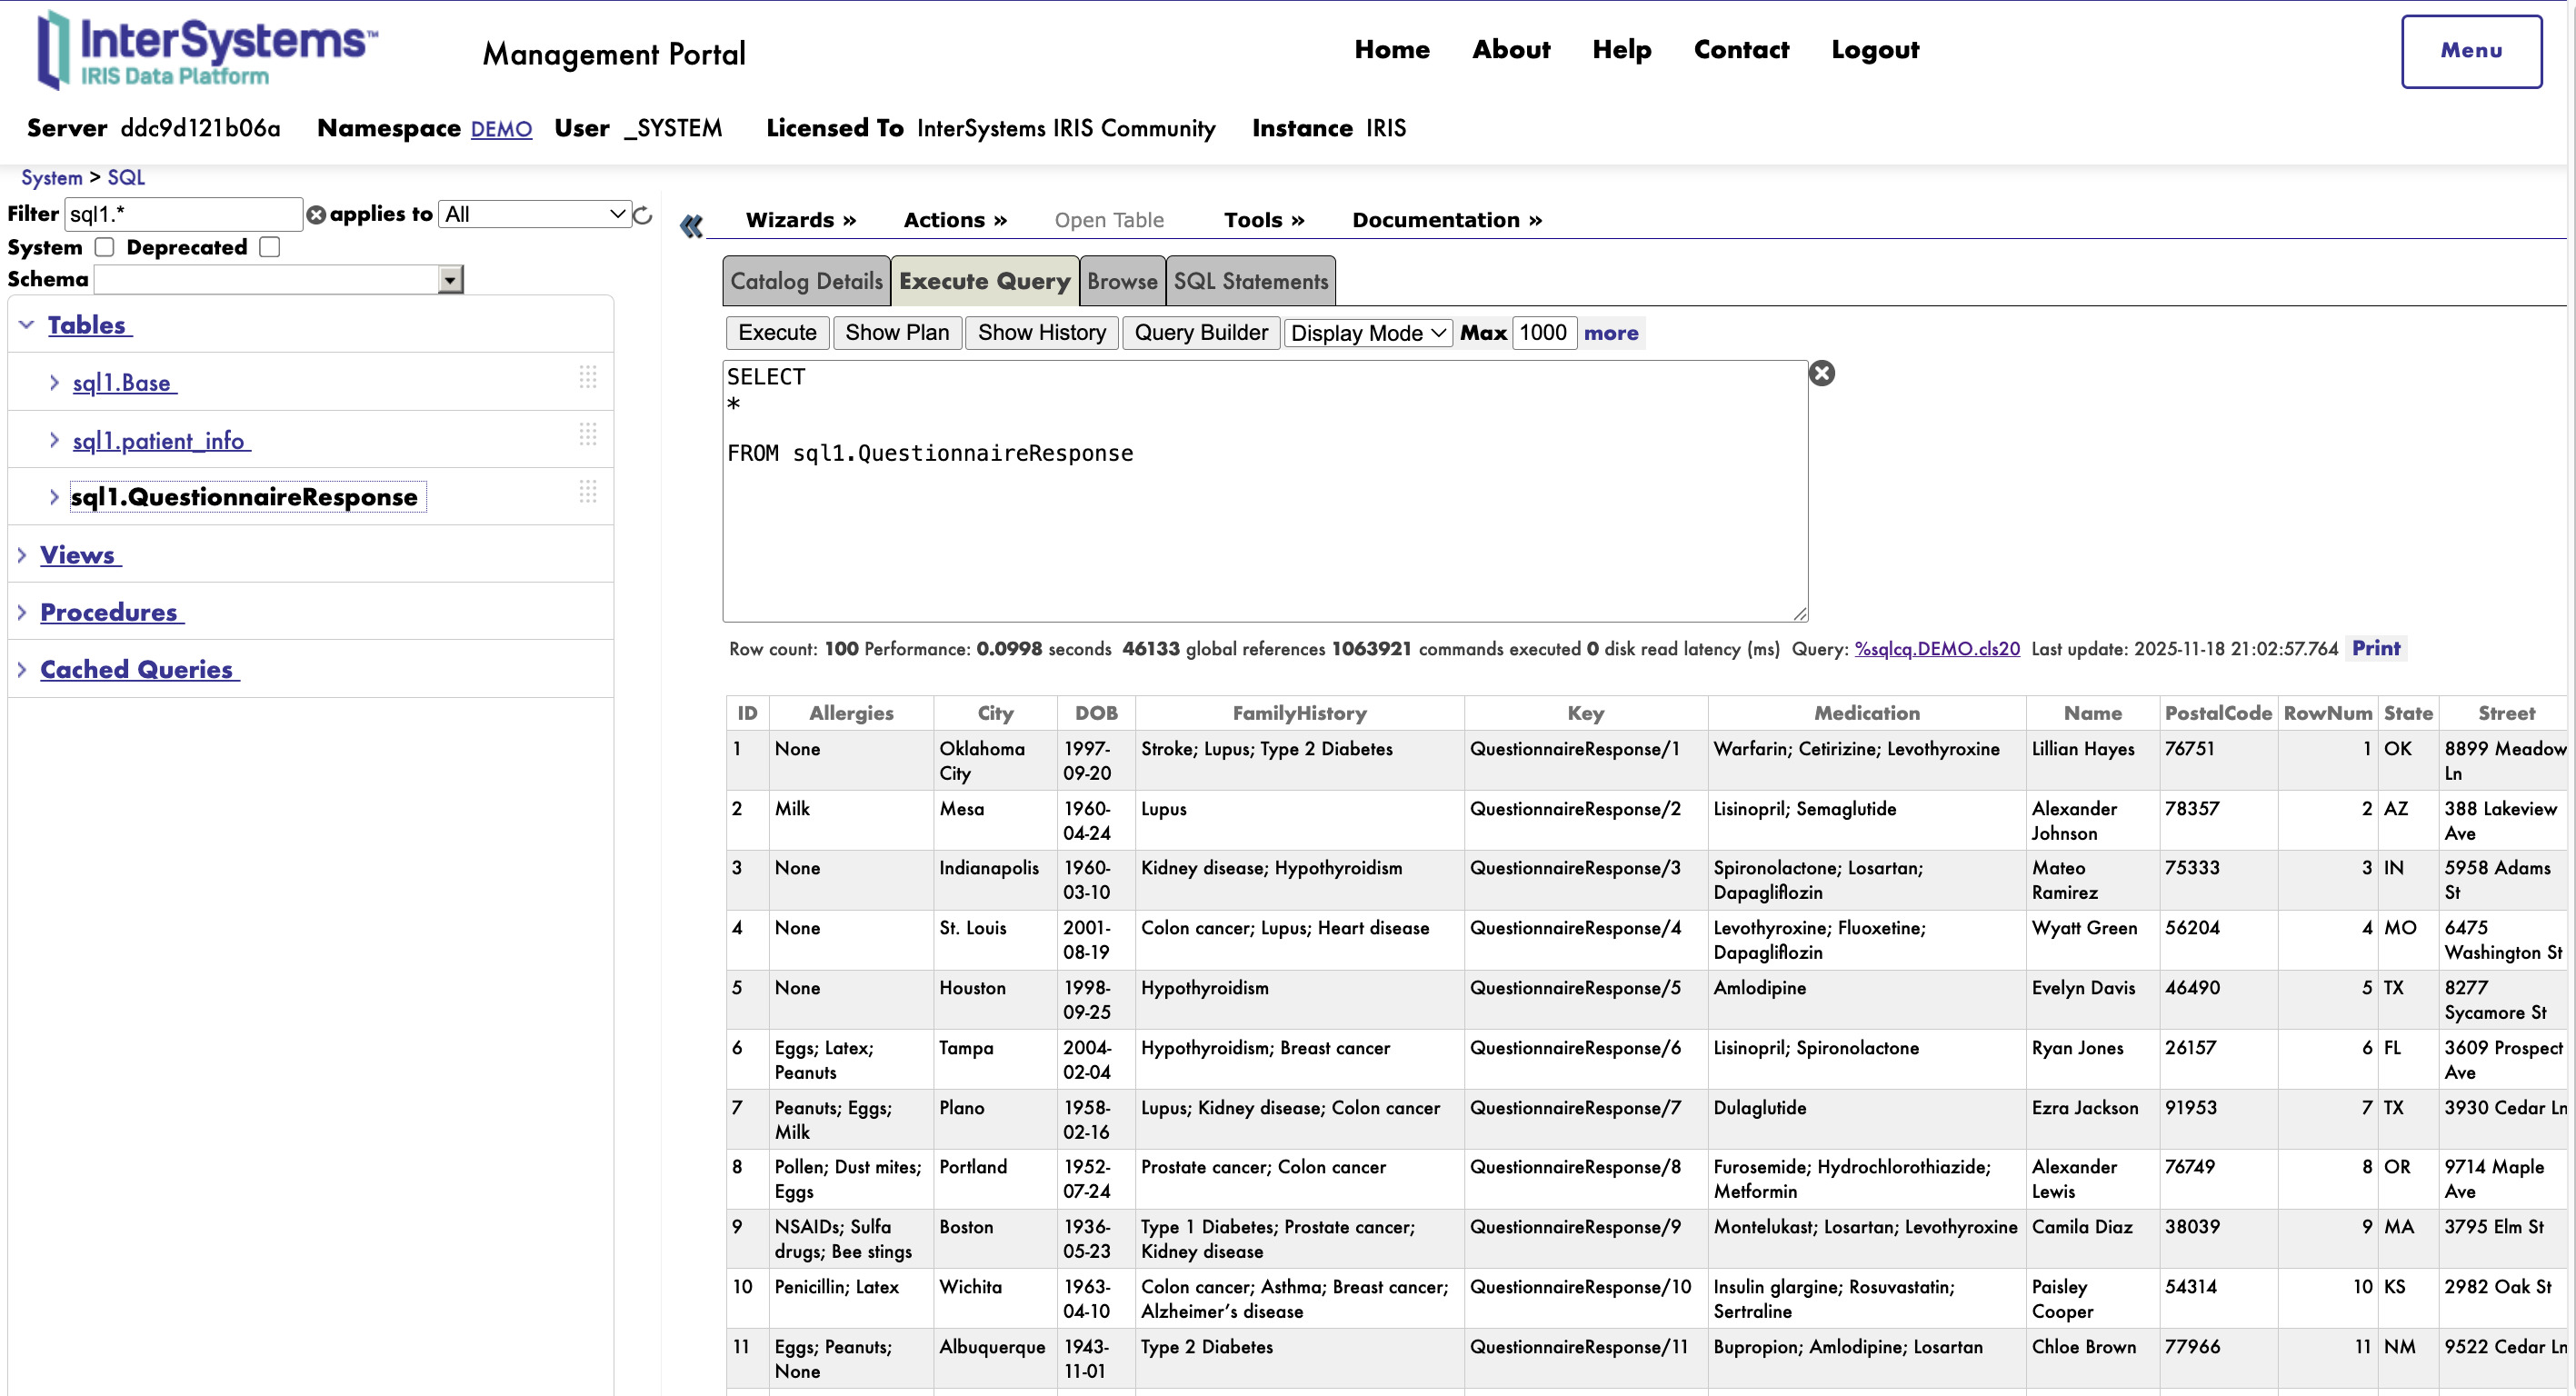
The InterSystems IRIS has some adapters available to capture data:
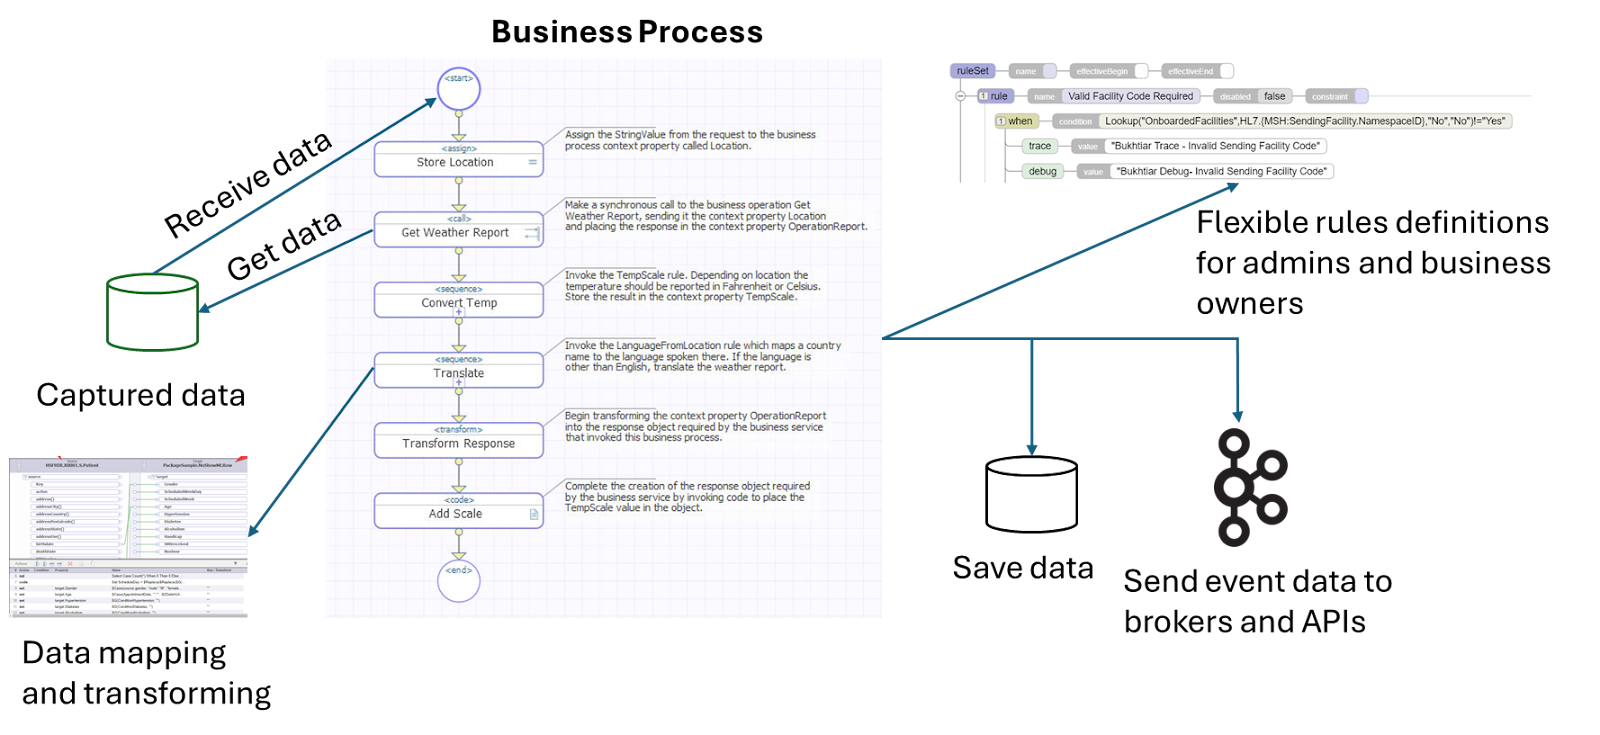
After capturing data, it is necessary to process the data using business processes, business rules, transformations and store the results into operational and analytics repositories:
In the context of Supply Chain, the following examples of information are generated for planning:
Sourcing Process
The sourcing process is fundamental for acquiring all the raw materials and other services and products necessary for the manufacturer's production from suppliers. This process requires integrating suppliers with the manufacturer to collect data and execute automated actions between systems to establish flows for price quotations, orders, purchases, deliveries, and continuous supplier evaluations, prioritizing economy, quality, and speed.
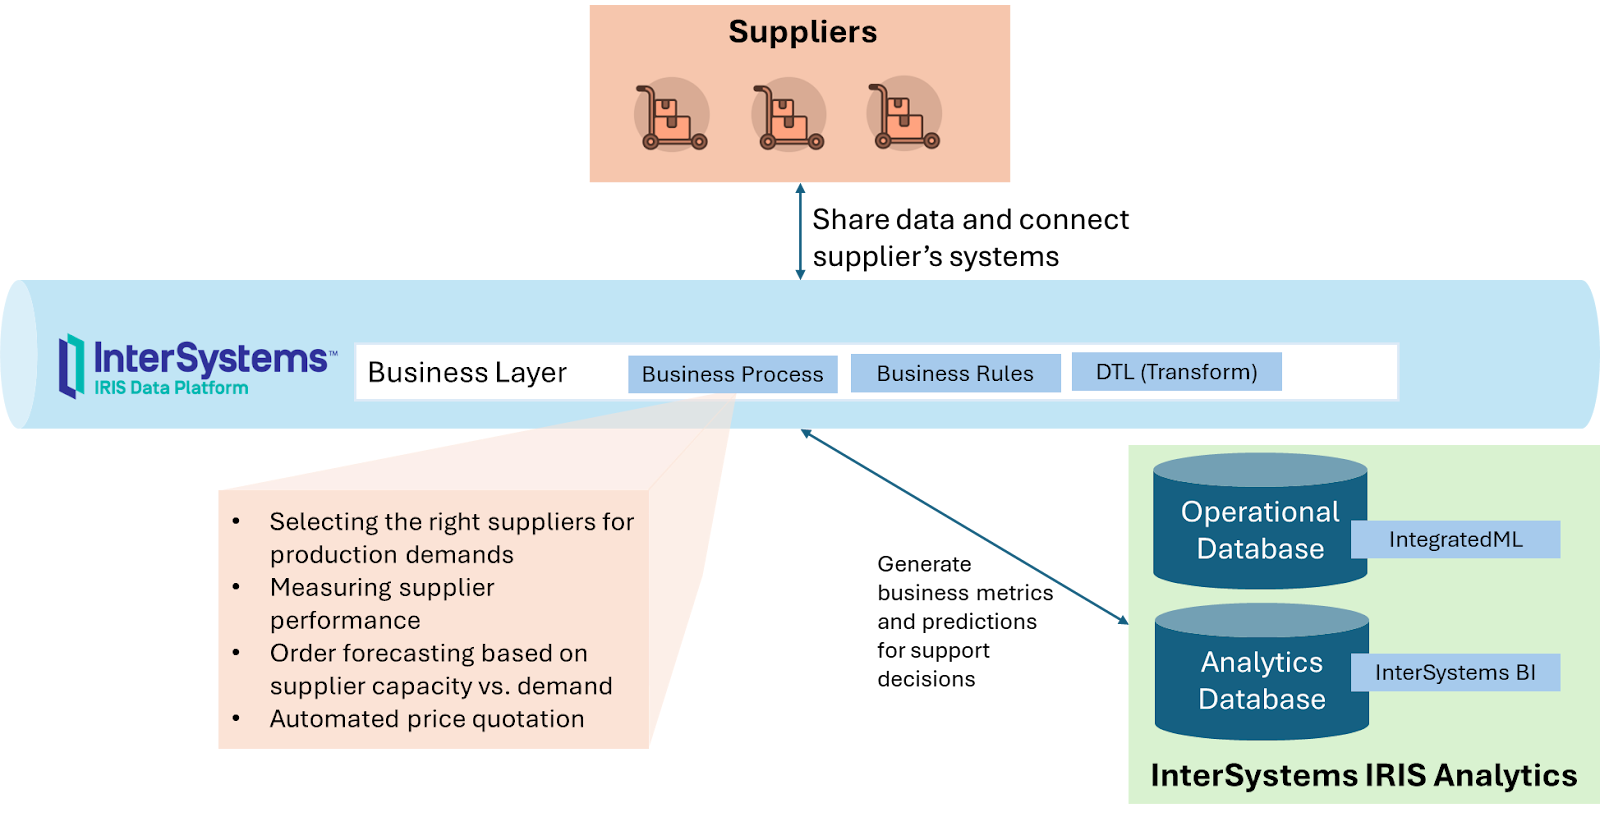
InterSystems IRIS operates at each stage according to the following table:
Manufacturing process
The manufacturing process consists of activities necessary to transform raw materials into goods.
The main activities involve starting with production planning and then separating the raw materials, assembling the production line, preparing and maintaining the machinery, carrying out production, performing quality control, and packaging for delivery. These activities have a high degree of automation. In this way, InterSystems IRIS becomes fundamental:
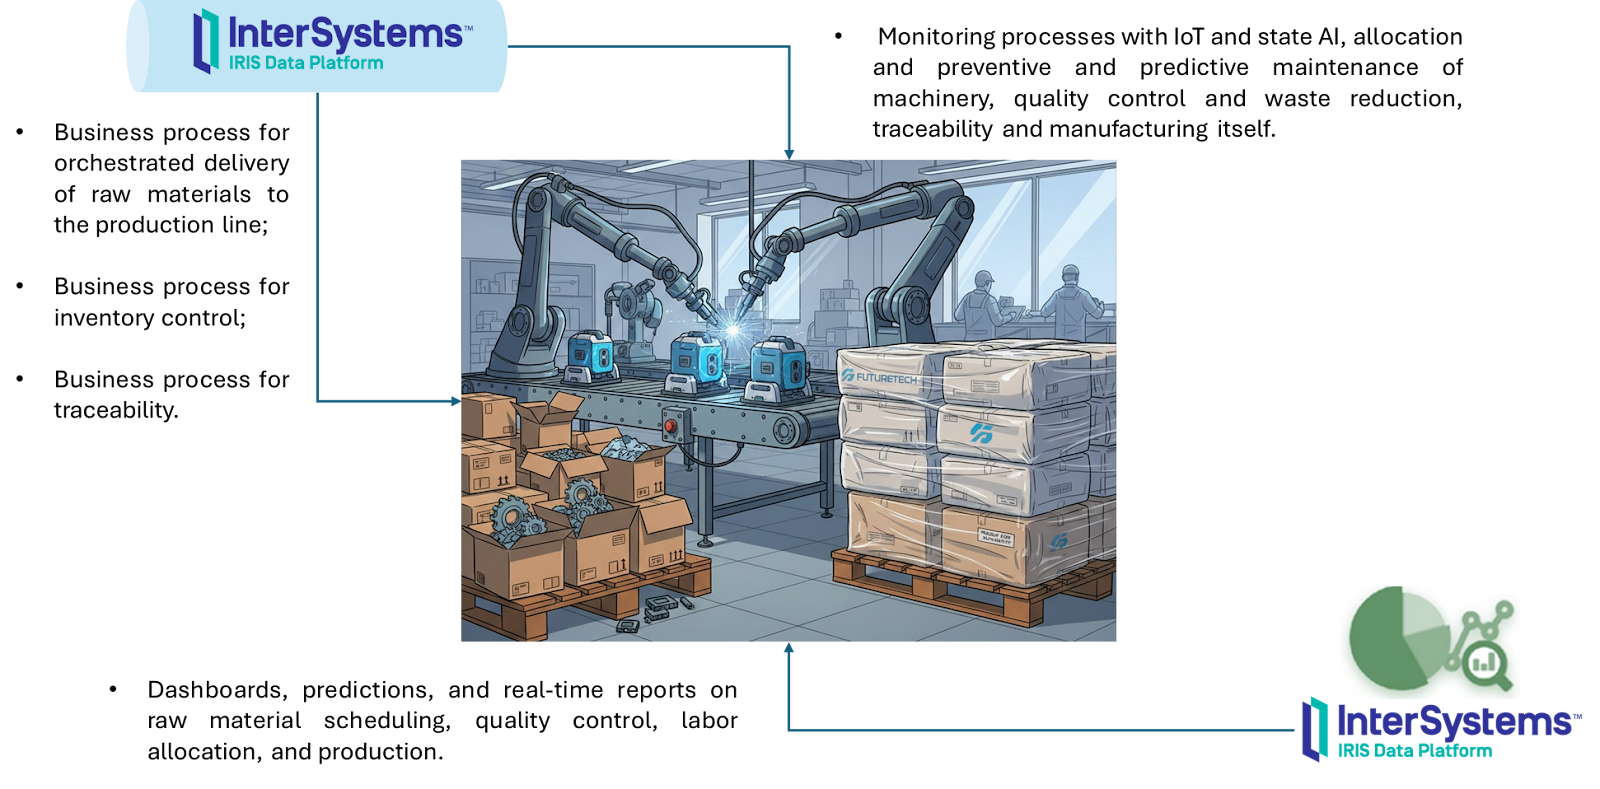
The following table details where the IRIS components operate to assist in the automation and improvement of the manufacturing process:
Delivery and Return Processes
The delivery and return processes are challenging and complex, involving the formation of a network of stores, distributors, distribution centers, and air, land, and sea carriers at a national and international level to ensure the manufactured product arrives at the right time and place at the lowest possible cost. This requires integrating data and processes from all parties involved to synchronize production and delivery capacity, and short-, medium-, and long-term demand:
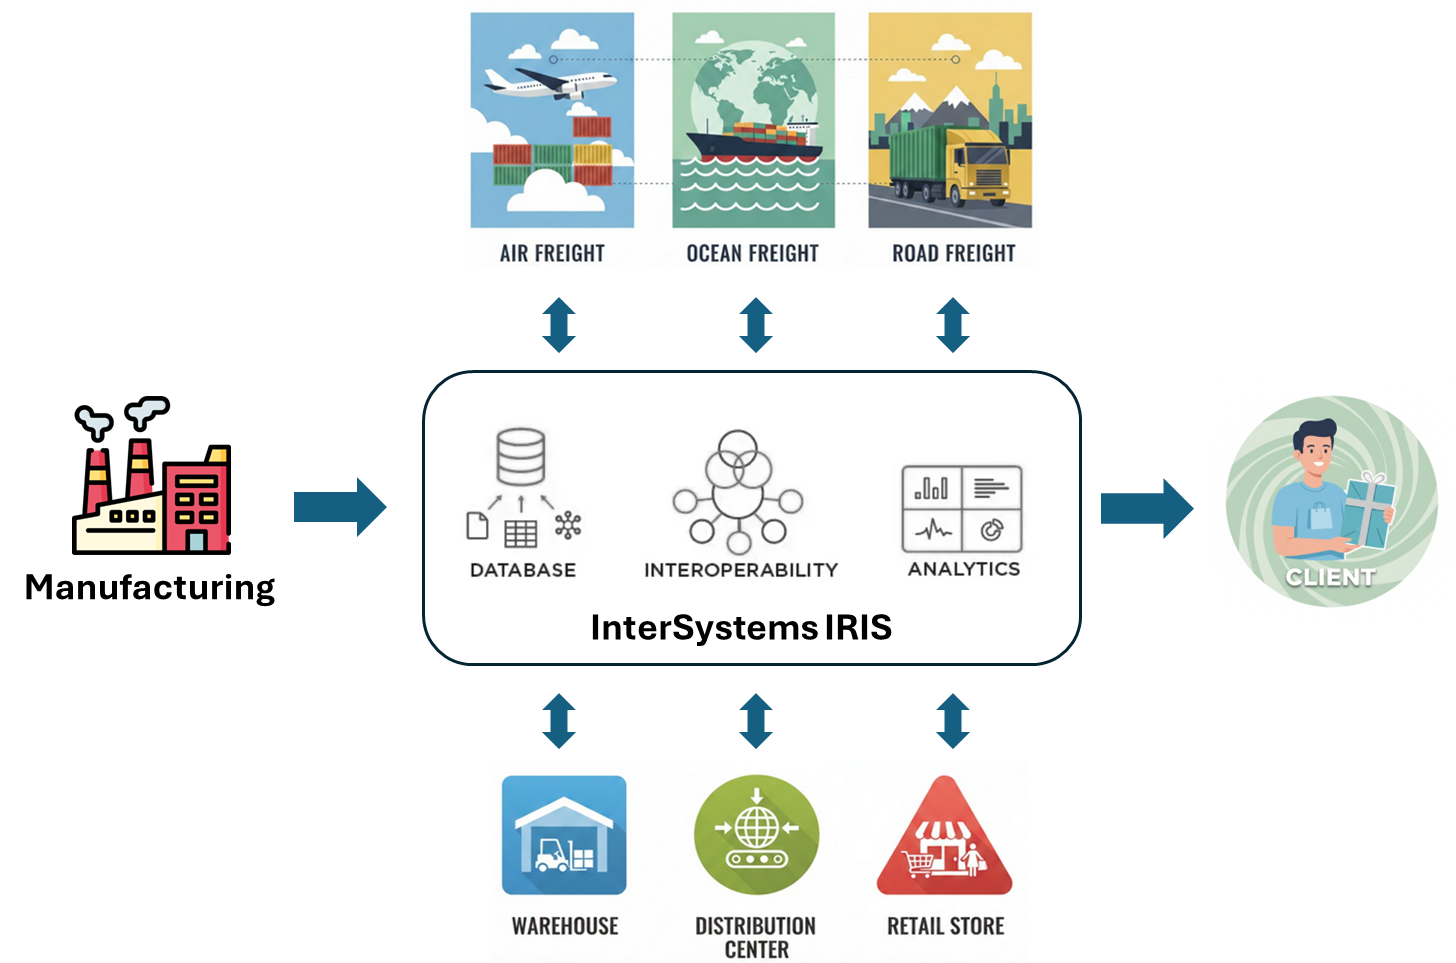
The following table details where the IRIS components operate to assist in the automation and improvement of the delivery and return processes:
Compilation of IRIS components used in Supply Chain and how to learn to use them
Below is a table detailing each component of IRIS used in Supply Chain projects, with links to resources on how to use them:
 Open Exchange

 。
。